

ARE BRITAIN’S YOUNG PEOPLE REALLY FALLING FOR DICTATORS? WHAT YOUTH POLLS TELL US, AND WHY WE SHOULDN’T IGNORE UNCERTAINTY
The question whether young people are keen to live in a dictatorship —or at least prefer it to democracy—has occupied the news in recent months.
Just two days ago, the think tank Onward published findings showing that “younger Brits emerge as much more likely than those in older age groups to hold a positive view of military strongman government, absolute monarchy, communism and fascism” (Onward, 2025). Specifically, 38% of 18-34-year-olds have a positive view of “a military strongman with no government or elections as a way of running the UK”.
Similarly, Channel 4’s poll in January 2025 caused a stir when finding that 52% of young people think “the UK would be a better place if a strong leader was in charge who does not have to bother with parliament and elections” (Channel 4, 2025). These questions often focus on strong leaders, and those running the poll—as well as pundits interpreting them—infer that Gen Z wants to live in a dictatorship. King’s College actually tested this ‘strongman’ hypothesis, and found that only 6% of Gen Z in the UK say they’d like the country to be ruled by a dictator. (King’s College, 2025)
In our UK Youth Poll 2025, we have asked young people directly whether they prefer to live in a dictatorship rather than a democracy. Here we will dive a bit deeper into what the numbers tell us. Comparing our data with data by Onward, Channel 4, and the World Values Survey reveals that not everything is as clear cut as it seems —and that the way data is analysed and presented can significantly skew results.
Dictatorship vs Democracy
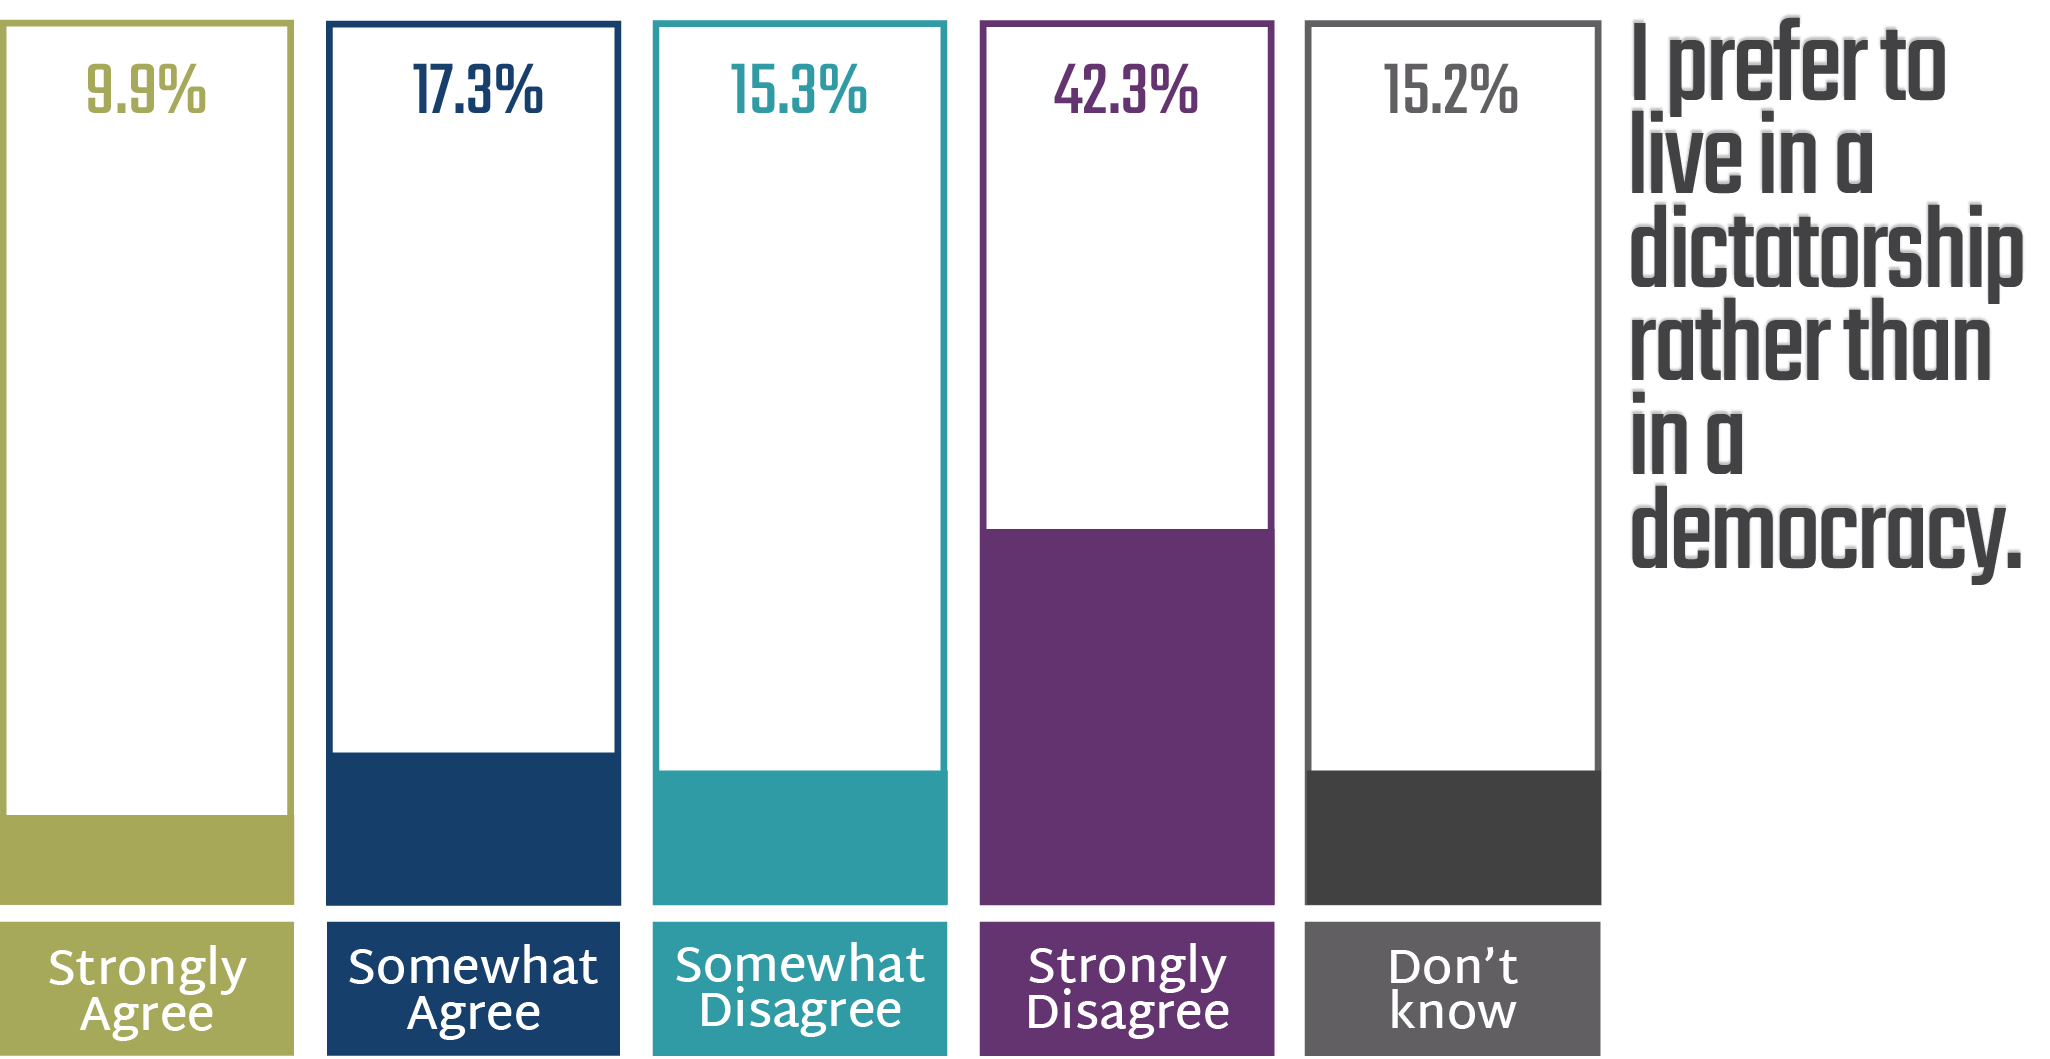
In our Youth Poll, 27% of respondents somewhat or strongly agreed they’d prefer to live in a dictatorship, 58% disagreed, and 15% said they didn’t know.
By age group, 16-17-year-olds showed the lowest agreement at 18%. Agreement was higher among 18-24s (30%) and 25-29s (27%). Disagreement levels were closer: 62% of 16-17s, 56% of 18-24s, and 59% of 25-29s disagreed. This is partly due to more 16–17s choosing “Don’t know” (20%) compared to 18–24s (14%) and 25–29s (15%).
Gender differences also emerged: 31% of men and 24% of women agreed with the statement. Disagreement was identical at 57% for both. Again, the difference lies in the “Don’t know” responses—chosen by 19% of women and just 12% of men.
Other demographic factors also shaped responses. Among full-time workers, 34% favoured dictatorship, while full-time students leaned strongly toward democracy (70% disagreed). Income showed a trend: the higher the income, the more likely someone was to favour dictatorship, while lower earners were more likely to say “Don’t know.”
Political alignment showed a clear pattern: 17% of those on the left preferred dictatorship, compared to 29% in the centre and 48% on the right. Among right-leaning respondents, disagreement dipped below agreement (46%). Political engagement also made a difference: 40% of those interested in organised politics preferred dictatorship, compared to just 19% of those without such interest. Also, of those who believe their vote can shape the UK’s future, 31% preferred dictatorship—compared to 24% among those who believe their vote cannot.
Who is Most Likely to Prefer Dictatorship?
- 34% of full-time workers
- 48% of right-leaning respondents
- 40% of those interested in organised politics
- 44% of those who say politics isn’t relevant to their lives
Who is Most Likely to Prefer Democracy?
- 70% of full-time students
- 74% of those who say politics is relevant to their lives
- 59% of 25–29-year-olds
- 57% of both men and women
Who is Most Likely to Say “Don’t Know”?
- 30% of the long-term unemployed
- 20% of 16–17-year-olds
- 19% of women
- 20% of those who are unhappy
- Only 5% of print newspaper readers
UK Youth Poll 2025: “I prefer to live in a dictatorship rather than in a democracy.” grouped by various demographic differences. (John Smith Centre, 2025)
A look back...
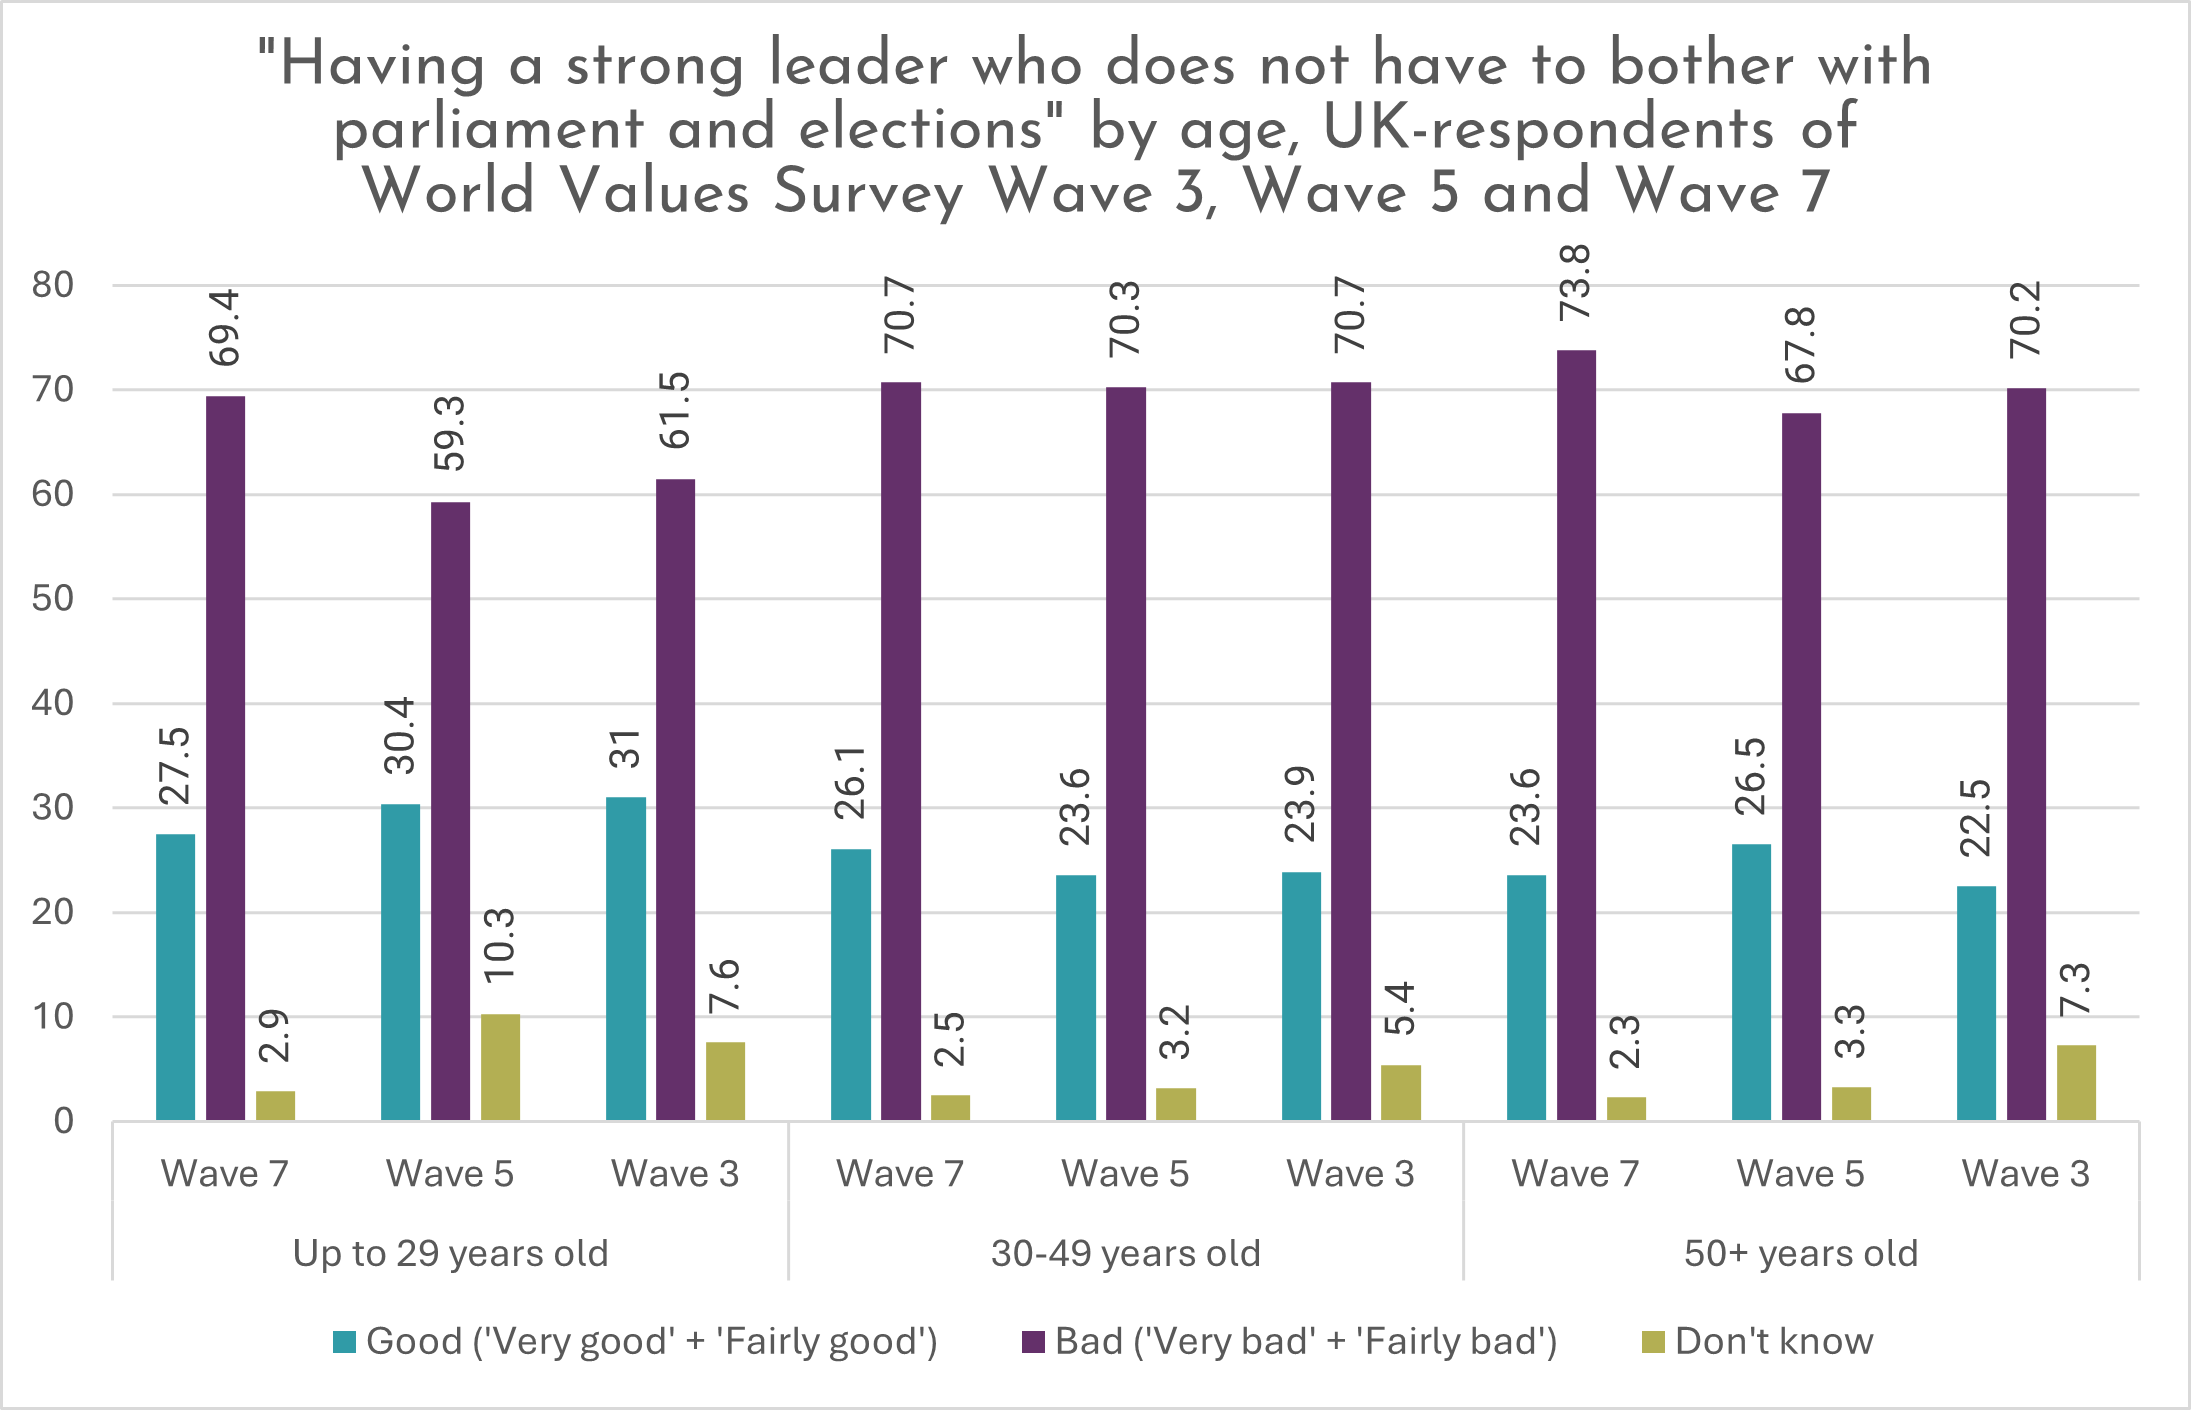
Before continuing, a small excursion to the World Values Survey is helpful. This global survey has run since 1981, polling people in various countries—including the UK—on a wide range of topics. Three recent waves asked about agreement with the statement: “Having a strong leader who does not have to bother with parliament and elections.”
In graph below, we see that older age groups have consistently been more likely to reject this idea than younger ones. Interestingly, approval among young people has hovered just below a third since 1995—and has actually declined slightly across the three waves. What is also noteworthy are the levels of not knowing. Also noteworthy are the “Don’t know” responses. While present in every wave, they’re consistently highest among the youngest respondents.
Don’t Know and Data Transparency
The careful reader might have noticed by now that many of the above Youth Poll findings show significant percentages choosing the “Don’t know” option. Overall, 15% (309 out of 2036 respondents) opted for it. That’s a considerable number, and higher than most other questions.
Demographic breakdowns offer more detail: 19% of women chose “Don’t know,” as did 20% of 16–17-year-olds and 30% of the long-term unemployed. Social media users were less certain (14%) than print newspaper readers (5%). Among those who are unhappy, 19% didn’t know, compared to 14% of those who are happy.
In the World Values Survey, “Don’t know” responses are included—and, as noted earlier, younger respondents consistently choose it more often. Unfortunately, Channel 4 and Onward did not show this data. Did they offer “Don’t know” as an option and simply omit the results? If so, is it included in their analysis—or excluded entirely? Or was it not offered at all?
To illustrate the impact: imagine 50% of respondents say “Don’t know,” 25% say yes, and 25% say no. If you omit the 50%, you’re left with a misleading 50:50 split. If younger people are more likely to say “Don’t know,” (as we have seen in the World Values Survey data) this skews generational comparisons. And if respondents weren’t even given the option, they may have been forced to choose on a complex issue.
While there may be cases where this is justified, the point here is: we simply don’t know how Channel 4 and Onward handled this—and that makes their findings a shaky foundation for sweeping claims.
So What?
From the data we’ve considered, it seems young people have long been more likely to favour a strong leader—and potentially dictatorship. This isn’t new, and we shouldn’t pretend it is. It also suggests that as people age, they become less likely to support such options. Perhaps it’s a side effect of youth to explore and favour extremes—for better or worse.
This long-term trend is worth bearing in mind when reading much of the current commentary which suggests that Gen Z is uniquely extreme in its views, as Onward tried to do this week. In fact, the longitudinal analysis suggests that young people have been like this, at least for the past few decades. The data suggests we should be wary of those people and those organisations which, in pursuit of social media clicks, seek to catastrophize today’s young people and claim the world under them is going to hell. Or as Prof Bobby Duffy from King’s College puts it:
“We always think this latest generation of young people are the worst in history. […] The reality is that nothing like half of Gen Z actually support a dictatorship in the UK, in any meaningful sense. They have significant issues with how the political system has not delivered for them, but they’re not looking to tear it up and replace it with autocratic leadership, and exaggerating that sense can only add to division and risk encouraging that outcome.”
Still, we shouldn’t ignore these numbers. Support for strong leadership and authoritarian rule appears to be growing. Even if 58% of our Youth Poll respondents prefer democracy, 27% hold the opposite view. And why do so many young people say they don’t know?
There is a clear need for better civic education and a more nuanced public conversation. How can we convey the value and hard-won merit of democracy? Democracy is not easy or straightforward. It’s messy, loud, and confusing—but also empowering, equalising, and colourful. We have a responsibility to show young people why democracy is worth defending. At the same time, we must acknowledge that the system isn’t working perfectly – and that democracy can (dare I say: must) evolve without being abandoned.
The number of “Don’t know” responses is significant (when the option is offered), and we must take that seriously. Yes, it might be shocking to some that someone could be unsure which system they prefer, but maybe their internal thinking is torn between ‘Things aren’t working’ and ‘I am not sure what a dictatorship really means.’ What can we do? Improve democracy. Highlight its virtues. And strengthen civic education—in schools and beyond.
Finally, a note to those commissioning and analysing polls: “Don’t know” and publishing data tables matters. Ignoring it—or omitting the option—skews results and fuels sensational headlines. Those of us with the power to shape public understanding must do so responsibly and transparently, with the complexity these issues—and people—deserve.

Bibliography
Channel 4 & Craft Research: Gen Z: Trends, Truth and Trust. Craft. Available online: < https://www.channel4.com/corporate/about-4/gen-z-trends-truth-and-trust> [Accessed 23 July 2025].
King’s College London. 2025. Just 6% of Gen Z – not over half – actually want a dictator, study finds. King’s College London. Available online: <https://www.kcl.ac.uk/news/just-6-of-gen-z-not-over-half-actually-want-a-dictator-study-finds> [Accessed 23 July 2025].
Loose, E., Barnes, E., 2025. UK Youth Poll 2025. John Smith Centre, Glasgow. Available online: <https://www.ukyouthpoll.com> [Accessed 23 July 2025].
Onward, 2025. Generation Extreme. Onward. Available online: <https://ukonward.com/reports/generation-extreme/> [Accessed 23 July 2025].
World Values Survey
- Wave 3: Inglehart, R., C. Haerpfer, A. Moreno, C. Welzel, K. Kizilova, J. Diez-Medrano, M. Lagos, P. Norris, E. Ponarin & B. Puranen et al. (eds.). 2014. World Values Survey: Round Three – Country-Pooled Datafile Version: www.worldvaluessurvey.org/WVSDocumentationWV3.jsp. Madrid: JD Systems Institute.
- Wave 5: Inglehart, R., C. Haerpfer, A. Moreno, C. Welzel, K. Kizilova, J. Diez-Medrano, M. Lagos, P. Norris, E. Ponarin & B. Puranen et al. (eds.). 2014. World Values Survey: Round Five – Country-Pooled Datafile Version: www.worldvaluessurvey.org/WVSDocumentationWV5.jsp. Madrid: JD Systems Institute.
- Wave 7: Haerpfer, C., Inglehart, R., Moreno, A., Welzel, C., Kizilova, K., Diez-Medrano J., M. Lagos, P. Norris, E. Ponarin & B. Puranen (eds.). 2022. World Values Survey: Round Seven – Country-Pooled Datafile Version 6.0. Madrid, Spain & Vienna, Austria: JD Systems Institute & WVSA Secretariat. doi:10.14281/18241.

Contribute
Share your research & insights with the world—submit your idea to our Research & Insights platform and reach a broader audience.
Submit Your Ideas